My role and responsibilities
As Head of UX Design at Muddy Boots for three years, I led the UX strategy and interaction design across the Greenlight product suite.
- Enterprise SaaS dashboard and interface design
- Establishing and maintaining a scalable design system
- Running user testing sessions and synthesising insights
- Cross-functional collaboration with product and engineering teams
- Wireframing, prototyping and high-fidelity UI design
- Stakeholder workshops and product steering groups
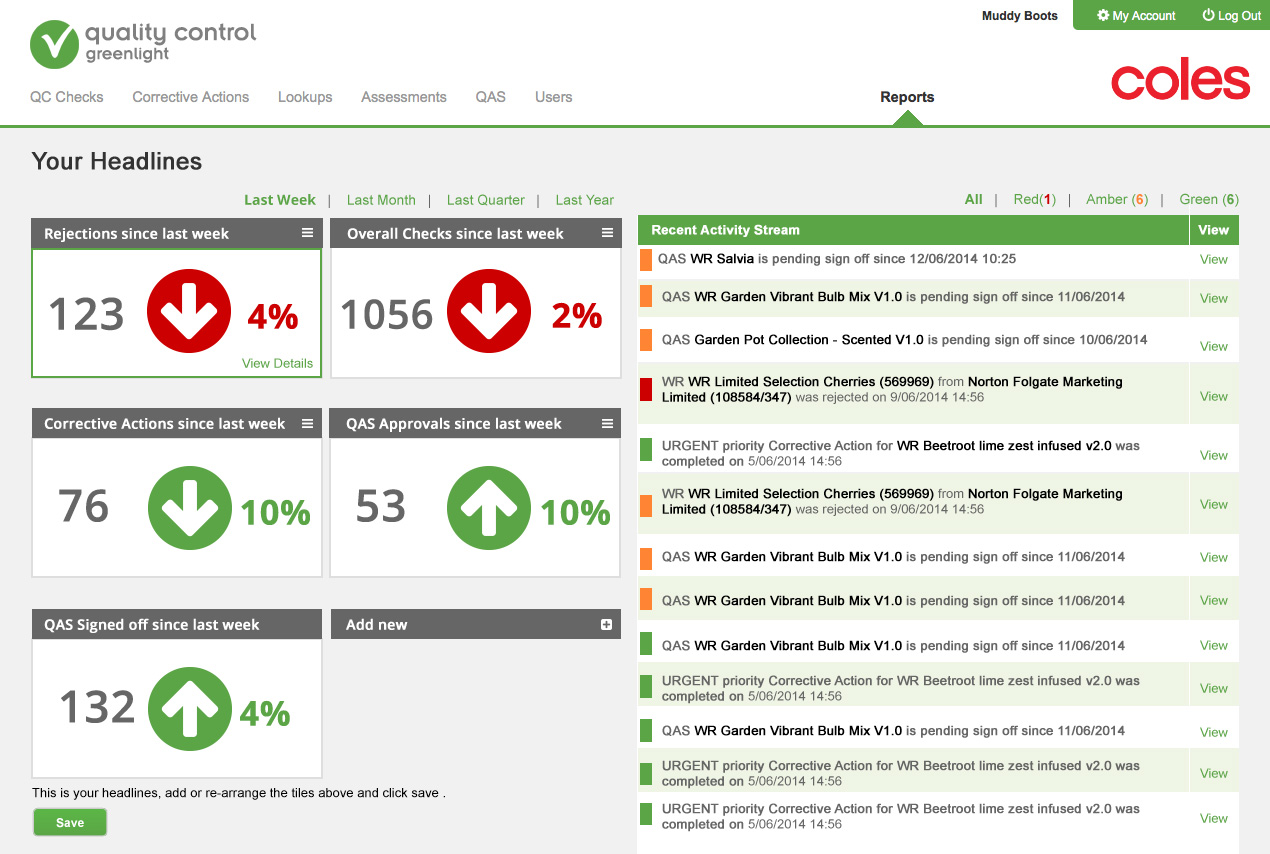
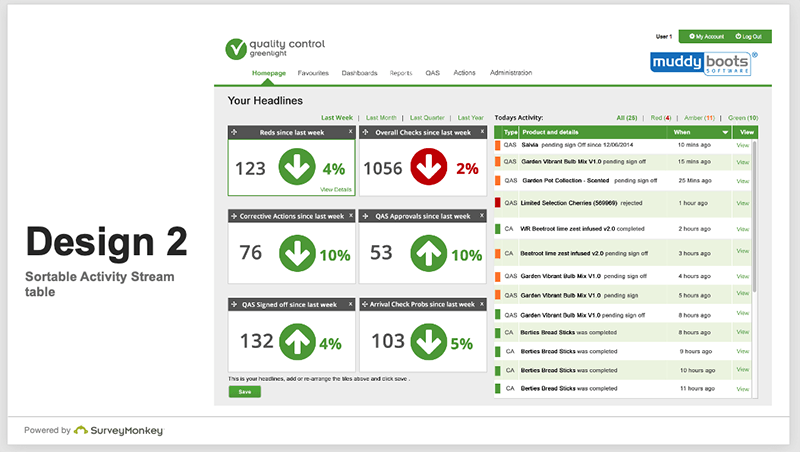
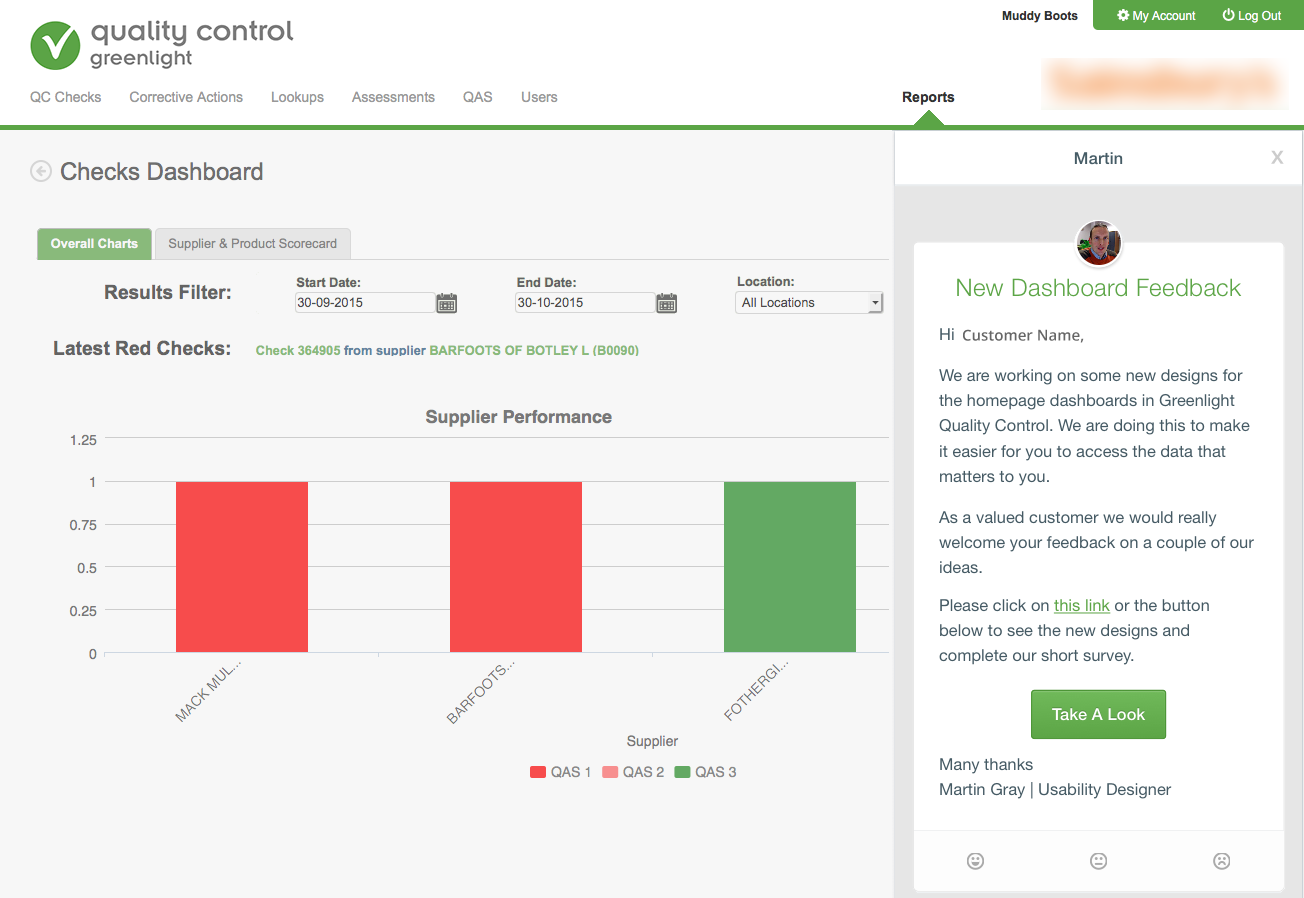
Challenge 1 — Quality Control Dashboard
Muddy Boots Quality Control software is a B2B SaaS platform used by supermarkets, suppliers and manufacturers to monitor supply chain compliance and product quality.
The existing homepage displayed a static list of assessments. It lacked hierarchy, data visualisation and quick access to frequently used reports, creating friction for repeat users.
Through user interviews, analytics review and contextual observation, I identified the need for a data-driven dashboard that surfaced key metrics immediately upon login.
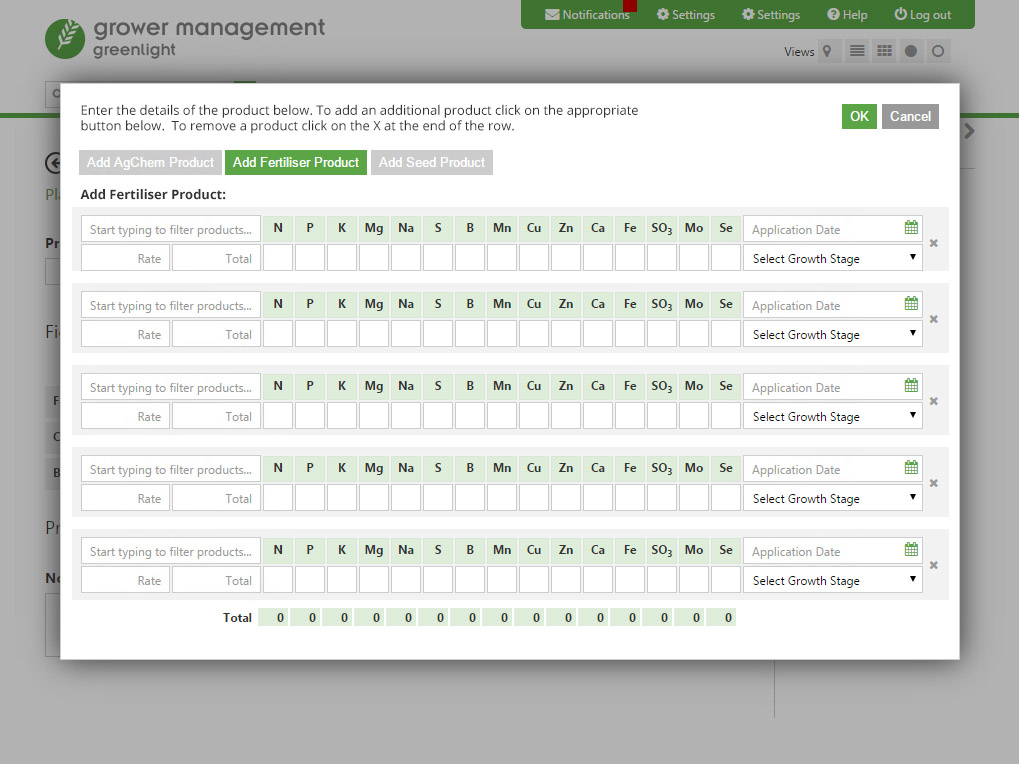
Challenge 2 - Crop managament tool
Greenlight Grower Management is an online crop management system from Muddy Boots. It enables field recording and crop data to be stored on the Cloud allowing farmer to share with agronomists and contractors.
A big feature of this software is mapping fields. Current users would simply name their or even describing their fields which is not helpful.
There was an idea raised that farmers or agronomists could add photos or even GPS co-ordinates. This proved inaccurate or time consuming. Instead i had the idea to use Google Maps in order to overlay the current location of the user and hopefully illustrate a clearer field boundary.
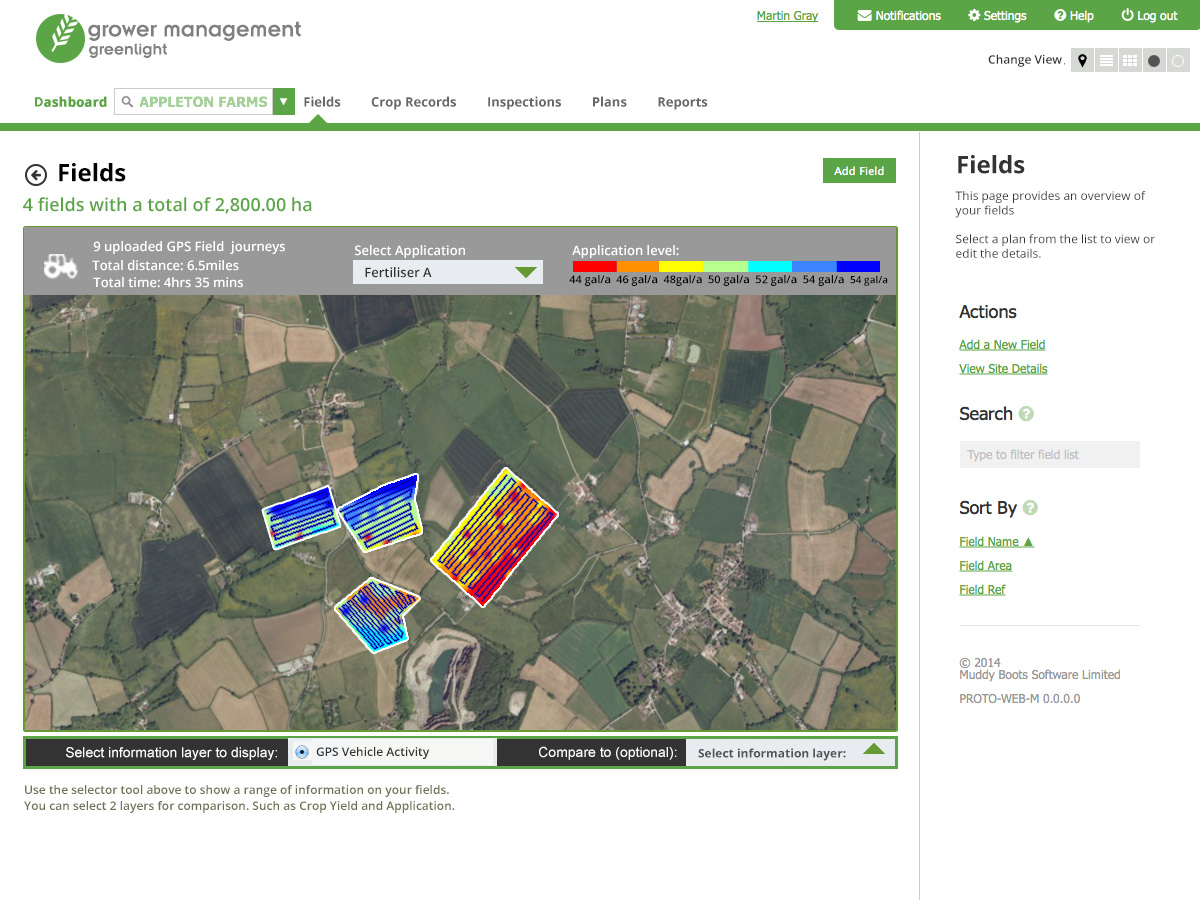
Below shows a selection of screenshots from the initial prototype that captures a submission date and displays the difference or time period with todays date.
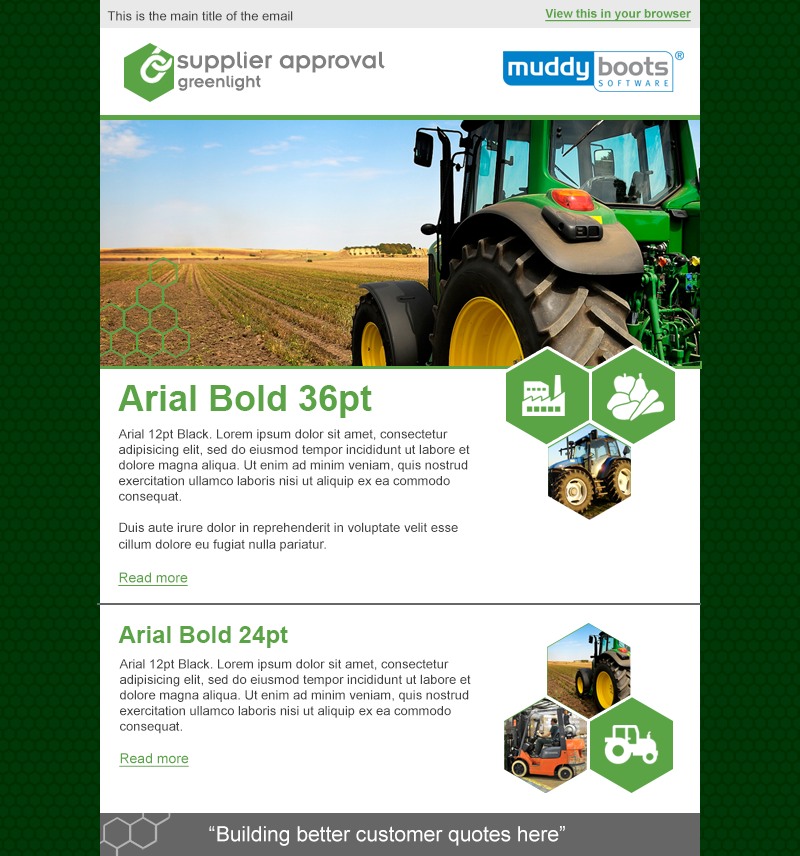
Design System & Online Style Guide
To ensure consistency across multiple SaaS products, I created and maintained an online design system with reusable UI components and coded style guidelines.
This centralised approach improved development efficiency, reduced UI inconsistencies and ensured accessibility standards were met across all applications.
I regularly ran meetings with the stakeholders to review product changes and ensure that the latest style guidelines were being adhered to. This is a constant cycle ensuring that the guide develops as more product features are created.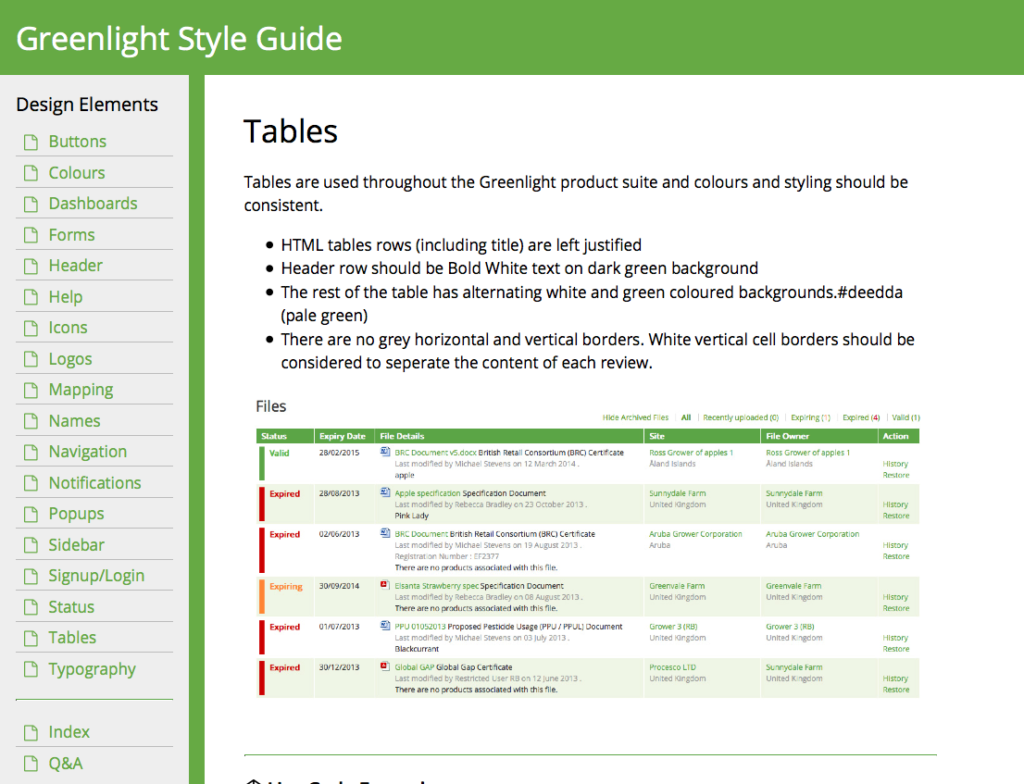

I applied similar interaction design principles at Polecat Software.